2. Revenue Operations Analytics
Kwanzoo Revenue Operations Analytics A Strategic Blueprint KK
001 Introduction TThe true vhe true value in yalue in your KPIs is undeour KPIs is understandrstanding hoing how thew they y wweaeavve toe togethegether to complete the bigger to complete the bigger picturr picture of the e of the ” customecustomer jr journeourneys thays that drit drivve the most e the most impact foimpact for yr your businessour business.. B2B buyers demand that brands deliver a buyer’s journey and customer lifecycle that provides a seamless experience. From research to renewal, today’s buyers expect to find almost everything they need digitally, without engaging in a live conversation with Sales so that they can make educated decisions. Along the way, there can be dozens of touch-points through multiple channels and tactics that help inform their decision. Your revenue operations analytics should be just as seamless of an experience for your internal teams and stakeholders. But while buyers today gain ever easier access to information from your brand (and potentially from your competitors as well), your dilemma as a B2B marketing leader compounds. In the last several years, there has been a massive increase in the number of tools a marketer needs to use while delivering buyers the experience that they are demanding. What’s more, as features multiply, these tools are providing more and more data. The result of all this is that a seamless journey from the customer’s perspective can often translate to a series of fragmented data views for the marketer or revenue operations professional. Key performance indicators (KPIs) are a great way to benchmark success. Unfortunately, hitting a few KPIs will not matter if your marketing organization as a whole is missing its baseline customer journey or customer experience targets. It can be difficult to understand why this is happening without an integrated approach to all of your data and analytics across marketing, sales, and customer success. How do different digital channels contribute traffic to your website? How do offline channels influence your digital engagement? Which campaigns drive the best conversion on your web forms? Which programs drive the most revenue and ROI across product lines, regions, and customers? The true value in your KPIs is understanding how they weave together to complete the customer journeys that drive the most impact for your business. What’s at stake? McKinsey reports that companies using an integrated analytics approach across their Go-to-market teams can free up 15% to 20% of marketing spend. Furthermore, companies can improve their analytics efficiency by 90% while lifting campaign conversions by 25%, according to a new study by Forrester. There’s a compelling business case for working smarter by getting the most out of all of your data. This paper will share the seven steps to get to integrated revenue operations analytics successfully. Read on now to understand how to execute on these steps — and what questions to ask before you delve into execution. Kwanzoo
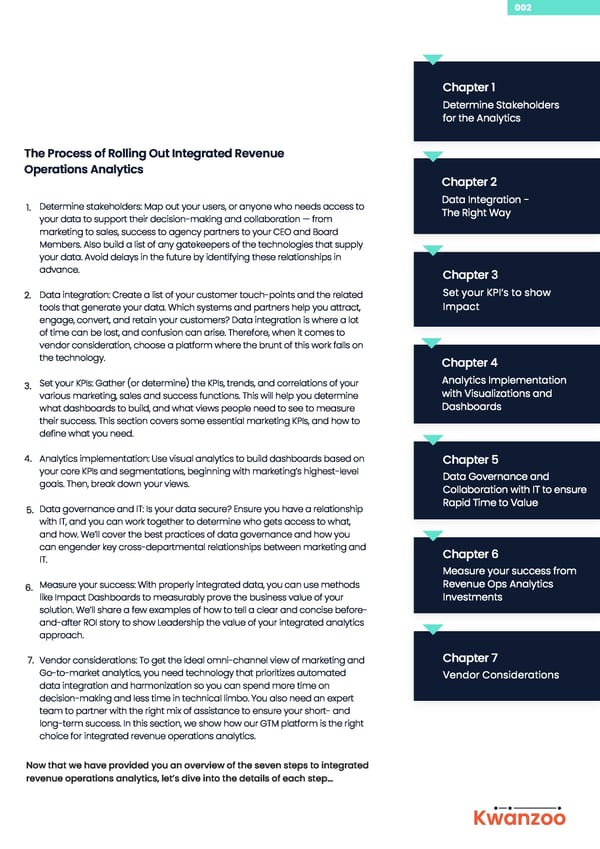
002 Chapter 1 Determine Stakeholders for the Analytics The Process of Rolling Out Integrated Revenue Operations Analytics Chapter 2 Data Integration - Determine stakeholders: Map out your users, or anyone who needs access to 1. The Right Way your data to support their decision-making and collaboration — from marketing to sales, success to agency partners to your CEO and Board Members. Also build a list of any gatekeepers of the technologies that supply your data. Avoid delays in the future by identifying these relationships in advance. Chapter 3 Set your KPI’s to show Data integration: Create a list of your customer touch-points and the related 2. Impact tools that generate your data. Which systems and partners help you attract, engage, convert, and retain your customers? Data integration is where a lot of time can be lost, and confusion can arise. Therefore, when it comes to vendor consideration, choose a platform where the brunt of this work falls on the technology. Chapter 4 Analytics Implementation Set your KPIs: Gather (or determine) the KPIs, trends, and correlations of your 3. with Visualizations and various marketing, sales and success functions. This will help you determine Dashboards what dashboards to build, and what views people need to see to measure their success. This section covers some essential marketing KPIs, and how to define what you need. 4. Analytics implementation: Use visual analytics to build dashboards based on Chapter 5 your core KPIs and segmentations, beginning with marketing’s highest-level Data Governance and goals. Then, break down your views. Collaboration with IT to ensure Rapid Time to Value Data governance and IT: Is your data secure? Ensure you have a relationship 5. with IT, and you can work together to determine who gets access to what, and how. We’ll cover the best practices of data governance and how you can engender key cross-departmental relationships between marketing and Chapter 6 IT. Measure your success from Revenue Ops Analytics Measure your success: With properly integrated data, you can use methods 6. like Impact Dashboards to measurably prove the business value of your Investments solution. We’ll share a few examples of how to tell a clear and concise before- and-after ROI story to show Leadership the value of your integrated analytics approach. Chapter 7 7. Vendor considerations: To get the ideal omni-channel view of marketing and Go-to-market analytics, you need technology that prioritizes automated Vendor Considerations data integration and harmonization so you can spend more time on decision-making and less time in technical limbo. You also need an expert team to partner with the right mix of assistance to ensure your short- and long-term success. In this section, we show how our GTM platform is the right choice for integrated revenue operations analytics. Now that we have provided you an overview of the seven steps to integrated revenue operations analytics, let’s dive into the details of each step… Kwanzoo
003 Chapter 1: Determine Stakeholders for the Analytics Who needs to access your data? Mapping out stakeholders in this process feeds every other part, because at the end of the day it’s people who run your business. It’s people who plan and execute your marketing campaigns, bringing their creativity and ingenuity to the table every day. An omni-channel go-to-market analytics strategy will help these people do their jobs better and more efficiently. Map out a list of who needs access to your data. Who needs to make decisions? Who needs to collaborate? Include any teams, but also include all individuals for laying out data governance later on. Consider marketing’s operational roles as well as leadership — and consider departments impacted by marketing such as finance, sales, and IT. “Mapping r“Mapping relaelatiotionships in advnships in advance wance will saill savve ye you a lou a lot ot of time in uneof time in unexpxpecteected delaysd delays, de, denialsnials, and sear, and searching ching fofor dar data sourta sources in the futurces in the futuree.” .” In addition, you’ll want to list the gatekeepers of your data — often those who lead the integrations of tools into your organization (for example, Salesforce, Google Analytics, internal customer databases). In larger enterprises, your gatekeepers can be individuals, teams, or even external agencies. Mapping these relationships in advance will save you a lot of time in unexpected delays, denials, and hunts for data sources in the future. The larger your organization, the more likely it is for these kinds of delays to occur. Key questions to answer Who needs access to your data? Who are the owners of the tools that generate your data (for example, Salesforce, Google Analytics, AdWords, social listening)? Who are the gatekeepers of the tools that store your first-party data (for example, sales or customer data in SAP, Oracle, SQL, Hadoop, Redshift)? Kwanzoo
004 Chapter 2: Data Integration - The Right Way First, you’ll want to determine what sources of data you need to bring together. In today’s B2B go-to- market process, there are so many tools in use that a single individual may not be aware of them all. Consider all of the touch-points your brand has from the customer journey perspective. This can include marketing, sales, success, and customer satisfaction programs. A pro tip is to review your budgets, and then reach out to stakeholders and budget owners to ensure every crucial tool has been accounted for. These can include tools under marketing or sales’ budget, free tools, as well as tools not under your department’s budget. “T“The plahe platfotform yrm you choose foou choose for rr reevveenue analytics must nue analytics must hahavve smart dae smart data inta intetegragratiotion and harmon and harmonizanizatiotion n capabilities designecapabilities designed fod for Go-to-markr Go-to-market teamset teams.” .” Data integration can be an incredibly time-intensive process — but it shouldn’t be. To offset increasingly limited IT resources and ever-shorter deadlines to manage marketing data’s messiness, you’ll want to ensure the platform you choose for revenue analytics has smart data integration and harmonization capabilities designed for go-to-market teams (marketing, sales, success). These are the capabilities that will turn your disconnected “apples and oranges” data into one “apples to apples” single source of truth. Technical difficulties, or the need to enlist the help of — or hire — specialized data scientists can hamstring the rest of the project, lead to data blind spots, and leave you second-guessing the veracity of your single source of truth. Make sure to prioritize data integration and data harmonization capabilities designed for you as a marketer. Key questions to answer Who needs access to your data? Who are the owners of the tools that generate your data (for example, Salesforce, Google Analytics, AdWords, social listening)? Who are the gatekeepers of the tools that store your first-party data (for example, sales or customer data in SAP, Oracle, SQL, Hadoop, Redshift)? Kwanzoo
005 Chapter 3: Set your KPI’s to show Impact If yIf you can’t easily bou can’t easily blelend ynd your daour data ta ” soursourcesces, y, you can’t unify you can’t unify your KPIsour KPIs. . How do your various marketing groups (or individuals) measure their success? The answer should be threefold — and all are quantifiable: KPIs, trends, and correlations. A defining feature of the integrated marketing analytics strategy is the unification of KPIs, trends, and correlations across views, for a seamless understanding of your marketing efforts. But in orderto unify something, you have to start with its parts. Since you’ve determined your stakeholders, briefly outline for each what their group does and how they measure success. Keep in mind the following types of KPIs, trends, and correlations for each team member: Volume KPIs and trends across channels and the customer journey such as total awareness, total engagement, total conversions, total marketing spend, total marketing-impacted revenue Efficiency KPIs and trends such as cross-campaign conversion rates, cost per lead, cost per engaged buyer and marketing ROI Correlations such as the relationship between offline and online activity, web traffic and leads, social activity and form completions, and ratios of lifetime customer values and customer acquisition costs per segment It’s important to note that if you can’t blend your data sources easily, you can’t unify your KPIs and, therefore, will be stuck in the past decade of siloed marketing analytics. An intelligent analytics platform will help you transcend your siloed and disparate data to bring your KPI metrics together without you having to think about it. Whereas KPIs blend your data on the metric level, classifications blend and join your data at the dimensional level. Document how your team will need to look at the data, filter it, and drill into it. This is the second key factor in how your dashboards will be created. In the next section, we’ll look at some examples in context. Key questions to answer How do my marketing team members measure their success? Which KPIs, trends, and correlations do they need to see to support their decision-making? In order to make comparisons and gain insight, how should our team filter the data? Read 16 KPIs every CMO must track Kwanzoo
006 Chapter 4: Analytics Implementation with Visualizations and Dashboards Now that you have your KPIs and data sources and understand who needs access to that data, you can build your dashboards. Visual analytics is essential to seeing insights in your data; human brains aren’t designed to spot trends in endless tables of numbers. To keep things simple, your analytics platform needs to make data integration easy and come equipped with compelling visualization capabilities, so building the dashboards is something revenue ops teams can quickly deliver to meet the needs of any business user. These days, most marketing tools offer some kind of stand-alone analytics pane where you can see how your efforts are performing. A step further, there are dashboarding tools that can bring these views together, so you’re looking at data from multiple tools in one place. But even with a visualization tool, you’re still only halfway to omnichannel marketing analytics. Looking at siloed reports of your various marketing initiatives is little better than what you get from the built-in analytics in the tools themselves. You need an analytics solution where blending and joining fields is easy — and fast. If you want to be thinking big-picture with your marketing efforts, you need to be able to pull up any KPI metric instantly you can think of and easily combine multiple metrics into one visualization. To illustrate the importance of unifying your KPIs, here are three examples of views that rely on blended data to tell big-picture stories: To illustrate the importance of unifying your KPIs, here are three examples of views that rely on blended data to tell big-picture stories: Kwanzoo
007 Executive Lens CMO View of Total Marketing Spend, Sales, Revenue, and Marketing ROI Kwanzoo
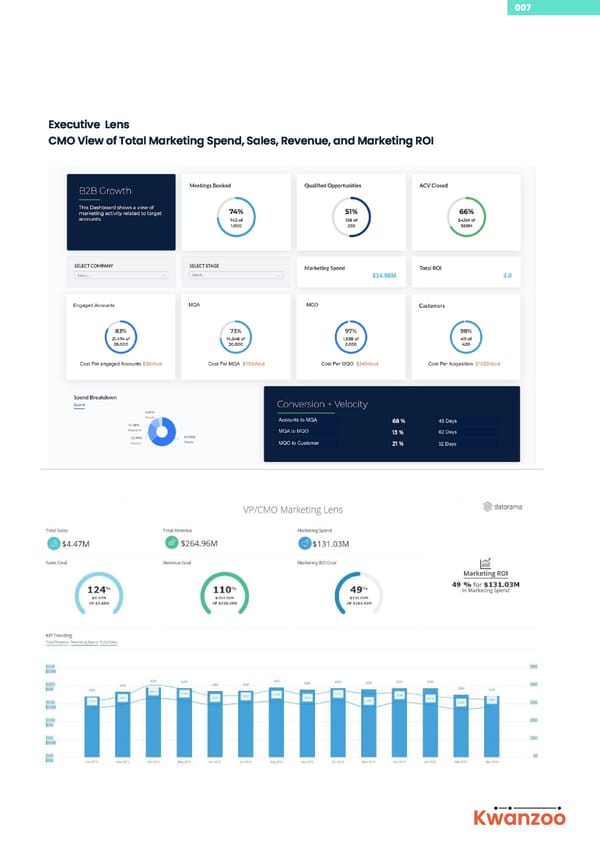
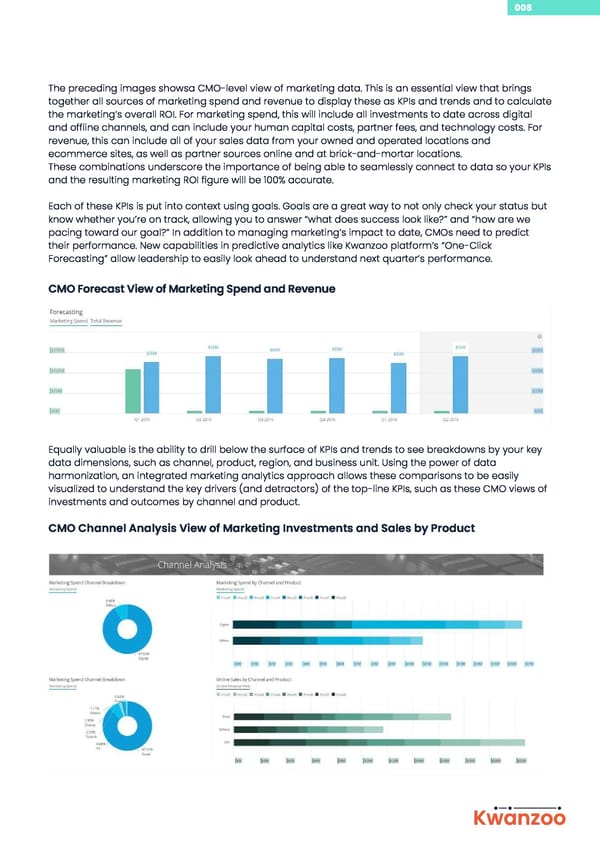
008 The preceding images showsa CMO-level view of marketing data. This is an essential view that brings together all sources of marketing spend and revenue to display these as KPIs and trends and to calculate the marketing’s overall ROI. For marketing spend, this will include all investments to date across digital and offline channels, and can include your human capital costs, partner fees, and technology costs. For revenue, this can include all of your sales data from your owned and operated locations and ecommerce sites, as well as partner sources online and at brick-and-mortar locations. These combinations underscore the importance of being able to seamlessly connect to data so your KPIs and the resulting marketing ROI figure will be 100% accurate. Each of these KPIs is put into context using goals. Goals are a great way to not only check your status but know whether you’re on track, allowing you to answer “what does success look like?” and “how are we pacing toward our goal?” In addition to managing marketing’s impact to date, CMOs need to predict their performance. New capabilities in predictive analytics like Kwanzoo platform’s “One-Click Forecasting” allow leadership to easily look ahead to understand next quarter’s performance. CMO Forecast View of Marketing Spend and Revenue Equally valuable is the ability to drill below the surface of KPIs and trends to see breakdowns by your key data dimensions, such as channel, product, region, and business unit. Using the power of data harmonization, an integrated marketing analytics approach allows these comparisons to be easily visualized to understand the key drivers (and detractors) of the top-line KPIs, such as these CMO views of investments and outcomes by channel and product. CMO Channel Analysis View of Marketing Investments and Sales by Product Kwanzoo
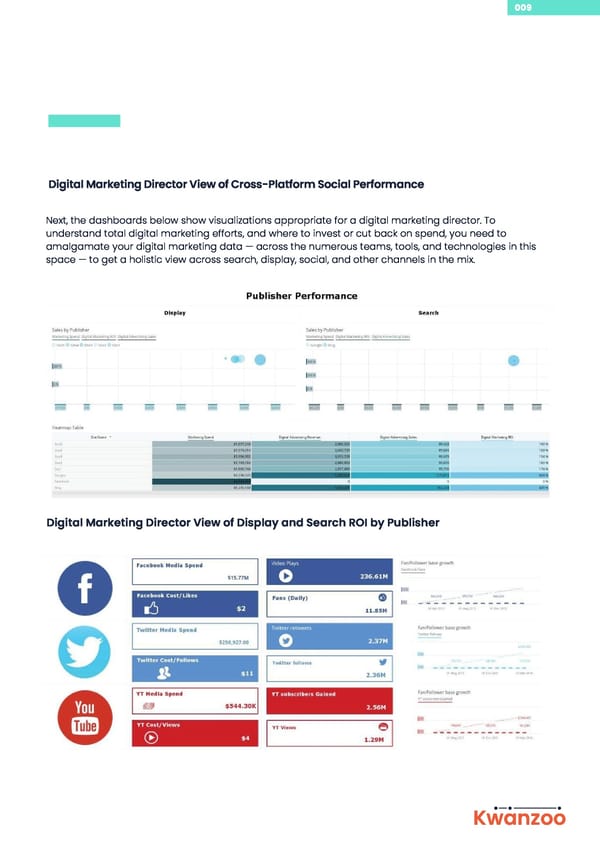
009 Digital Marketing Director View of Cross-Platform Social Performance Next, the dashboards below show visualizations appropriate for a digital marketing director. To understand total digital marketing efforts, and where to invest or cut back on spend, you need to amalgamate your digital marketing data — across the numerous teams, tools, and technologies in this space — to get a holistic view across search, display, social, and other channels in the mix. CMO Forecast View of Marketing Spend and Revenue Digital Marketing Director View of Display and Search ROI by Publisher Kwanzoo
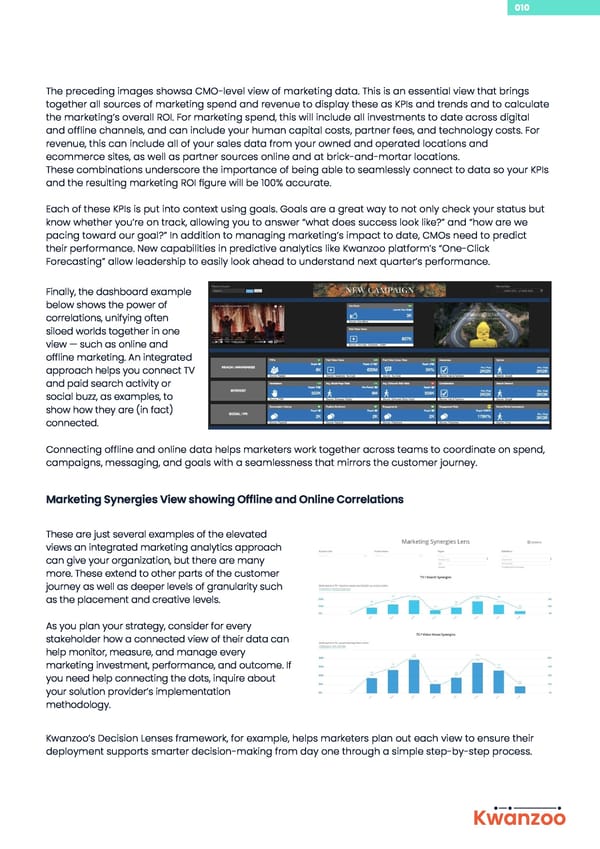
010 The preceding images showsa CMO-level view of marketing data. This is an essential view that brings together all sources of marketing spend and revenue to display these as KPIs and trends and to calculate the marketing’s overall ROI. For marketing spend, this will include all investments to date across digital and offline channels, and can include your human capital costs, partner fees, and technology costs. For revenue, this can include all of your sales data from your owned and operated locations and ecommerce sites, as well as partner sources online and at brick-and-mortar locations. These combinations underscore the importance of being able to seamlessly connect to data so your KPIs and the resulting marketing ROI figure will be 100% accurate. Each of these KPIs is put into context using goals. Goals are a great way to not only check your status but know whether you’re on track, allowing you to answer “what does success look like?” and “how are we pacing toward our goal?” In addition to managing marketing’s impact to date, CMOs need to predict their performance. New capabilities in predictive analytics like Kwanzoo platform’s “One-Click Forecasting” allow leadership to easily look ahead to understand next quarter’s performance. Finally, the dashboard example below shows the power of correlations, unifying often siloed worlds together in one view — such as online and offline marketing. An integrated approach helps you connect TV and paid search activity or social buzz, as examples, to show how they are (in fact) connected. Connecting offline and online data helps marketers work together across teams to coordinate on spend, campaigns, messaging, and goals with a seamlessness that mirrors the customer journey. Marketing Synergies View showing Offline and Online Correlations These are just several examples of the elevated views an integrated marketing analytics approach can give your organization, but there are many more. These extend to other parts of the customer journey as well as deeper levels of granularity such as the placement and creative levels. As you plan your strategy, consider for every stakeholder how a connected view of their data can help monitor, measure, and manage every marketing investment, performance, and outcome. If you need help connecting the dots, inquire about your solution provider’s implementation methodology. Kwanzoo’s Decision Lenses framework, for example, helps marketers plan out each view to ensure their deployment supports smarter decision-making from day one through a simple step-by-step process. Kwanzoo
011 YYour analytics plaour analytics platfotform must come equipprm must come equippeed d ” wwith poith powweerful and corful and cogegennt visualizat visualizatiotion n capabilitiescapabilities, so y, so you can quickly meou can quickly meet the neet the neeeds ds of any business useof any business userr.. Tips on dashboarding The intention of this paper is not to teach visual analysis best practices (although exploring this science is immensely valuable). However, visual analysis is a necessary step in the journey to an effective omni- channel marketing analytics strategy. Beyond eye-catching dashboards, to ensure your dashboards are useful, remember that every dashboard should support decision-making and collaboration for the team member(s) it serves. By considering how each element of your dashboard helps to answer a question, you will ensure that it is actionable and supportive of driving real value in your business through data. Key questions to answer What individuals, teams, and external groups will be using this dashboard? What KPIs, trends, and correlations do they need to see? What kinds of filters do they need to drill into the data? How can goals and alerts help them focus on the right data at the moment? What other ways can data support them besides dashboards, such as scheduled reports, embedded versions, and new IoT integrations such as Amazon Alexa voice-powered queries. Kwanzoo
012 Chapter 5: Data Governance and Collaboration with IT to ensure Rapid Time to Value Data is increasingly considered one of the most important resources for a business. You need to ensure your data meets legal, compliance, and regulatory requirements before you scale, so you don’t end up creating a growing problem. Check with your solution vendor and validate with IT to ensure your implementation meets all of these requirements. Though your go-to-market (marketing, sales, success) team members should be able to easily access and make sense of the data, it’s important that the data governance approach of your platform provides for efficient management of user access to the platform’s capabilities and the data itself. “T“The dahe data gota govveernance apprrnance approach of yoach of your plaour platfotform rm should prshould proovide fovide for efficier efficiennt managemet managemennt of uset of user access r access to the plato the platfotform’s capabilities and the darm’s capabilities and the data itself.” ta itself.” On both fronts, you need to be able to restrict permission for users, teams, and potentially external groups such as agency partners. You also need to ensure your solution provider’s infrastructure is certified and secure. Look for standardized certifications such asISO 27001 and partner with IT to include them in the vetting process. Do your marketing leaders work with IT leaders? Based on the stakeholders you assembled in step one, kick-start these relationships to let both parties know they will be working together in some capacity. Staying aware of what tools are in use, and the utilization of these tools, is not only useful for data integration but also for identifying who needs access to what data. Key questions to answer Who should have access to the platform’s capabilities for data integration, harmonization, KPI creation, dashboarding building, and dashboard viewing within your organization? Are there security restrictions by stakeholders either at the source level or the row level (for example, a metric within a data source)? Is there specific data that only specific stakeholders can have access to? Are there specific data sets that partners can only have access to? Does your vendor partner’s data security meet your company’s user access and data security requirements? Are there security enablers you can leverage in your deployment, such as single sign-on (SSO)? Do your marketing leaders already work closely with your IT leaders? Kwanzoo
013 Chapter 6: Measure your success from Revenue Ops Analytics Investments Even if it’s obvious to you, as a marketing leader you’ll need to credibly prove the business impact of your solution. The precursor is illustrating the structure you’ve now set in place using this guide, with anecdotes about overcoming roadblocks and bottlenecks by making marketing better aligned in its data usage — both internally and with external groups like IT and agencies. For measurable proof, there are standardized methods for quantifying the business value of a solution. In a recent study in coordination with Forrester Consulting with one client, a $15 billion telecommunications and media company, the results of its integrated marketing analytics deployment using the platform showed significant ROI in following key areas: Total Business Impact: $9.8 million in total economic impact Marketing Performance and Impact Optimization: The direct profitability impact of a 25% increase in campaign conversion rates Marketing Analytics Efficiency Optimization: The time andcost savings of 2,600 hours reclaimed from data preparation tasks Marketing Budget Optimization: 14% budget savings and reallocations due to smarter decision- making across internal and agency partner programs These represent three key areas where you can quantify your investment in an integrated marketing analytics approach. To learn more about this success story and its underlying quantified ROI methodology, we invite you to read Forrester’s Total Economic Impact study. Don’t forget to show numeric changes in these areas Improved campaign profitability through creative- and placement-level optimization Total awareness, engagement, and conversion growth Lead, MQL, and SQL growth Kwanzoo
014 Chapter 7: Vendor Considerations YYou neou neeed a GTM plad a GTM platfotform tharm that automat automates the tes the tradtraditioitionally onally onenerrous and time-coous and time-consuming parts of nsuming parts of ” yyour analytics implemeour analytics implemenntatatiotion, likn, like dae data inta intetegragratiotion, n, harmoharmonizanizatiotion, and dan, and data modelingta modeling Many of these steps are made easier by — or are even contingent on — having the most cutting-edge marketing analytics solution available.Because the reality is that the number of necessary data sources for marketers is compounding. Technologies are increasing. The greatest constant in marketing is change. The key is making sure you have everything you need in one centralized seamless environment that’s easy to use and easy to manage. You need a solution that does all of this, and provides a platform where you can execute your integrated marketing strategy from top to bottom. That’s why you need a platform that takes the smartest approach possible beneath the dashboard level to make sure your data is always connected, clean, and organized. For this you need a platform that automates the traditionally onerous and time-consuming parts of your analytics implementation, like data integration, harmonization, and data modeling. Simple management of these steps will be the foundation of maintaining a reliable single source of truth regardless of how much your data changes or grows. To that end, beware of services-mandatory implementations and maintenance plans that will slow you down, incur unexpected costs, and open up the possibility of data gaps in your single source of truth. Instead look for speed, scale, and agility in your platform, powered by smart technology that simplifies the most time-consuming and expensive aspects of your integrated marketing analytics. Kwanzoo
015 To see how our GTM platform can help you operationalize your entire GTM process, including all of your revenue operations analytics, visit https://www.kwanzoo.com/demo. Kwanzoo provides the industry’s first Go-to-Market (GTM) platform that operationalizes the entire GTM process across all customer-facing roles, from the CEO to the frontline rep. Using Kwanzoo, marketers at global B2B enterprises, SaaS unicorns, and high-growth startups can align their GTM strategy, data, and key metrics, execute marketing and advertising programs and optimize business impact. Kwanzoo’s platform combines best-in-class account-based (ABM) advertising with website content, traffic analysis, and “out-of-the-box” integrations into 150+ marketing, sales, and success platforms and tools. Customizable dashboards and visualizations with AI-powered revenue operations intelligence streamline the GTM process across the organization. Kwanzoo’s unique Sales UI delivers actionable insights that improve sales productivity to grow pipeline and revenue. With an open GTM data model, advanced data harmonization, ready-to- deploy applications for marketing attribution, account and buyer journeys, and media planning and optimization, Kwanzoo helps Customers simplify and consolidate their technology investments. Kwanzoo’s self-service UI comes with strategic GTM services for experience design, customized analytics, and total customer success (CS) support for program execution. Our flexible service delivery model allows Customers to use in-house, outsourced, or agency partner teams directly on the platform. Kwanzoo